| Description |
3Q2025 |
3Q2024 |
2024 |
2023* |
2022* |
2021 |
| Net Revenues |
1.168.165 |
1.334.399 |
1,971,896 |
1,487,588 |
2,062,171 |
1,380,071 |
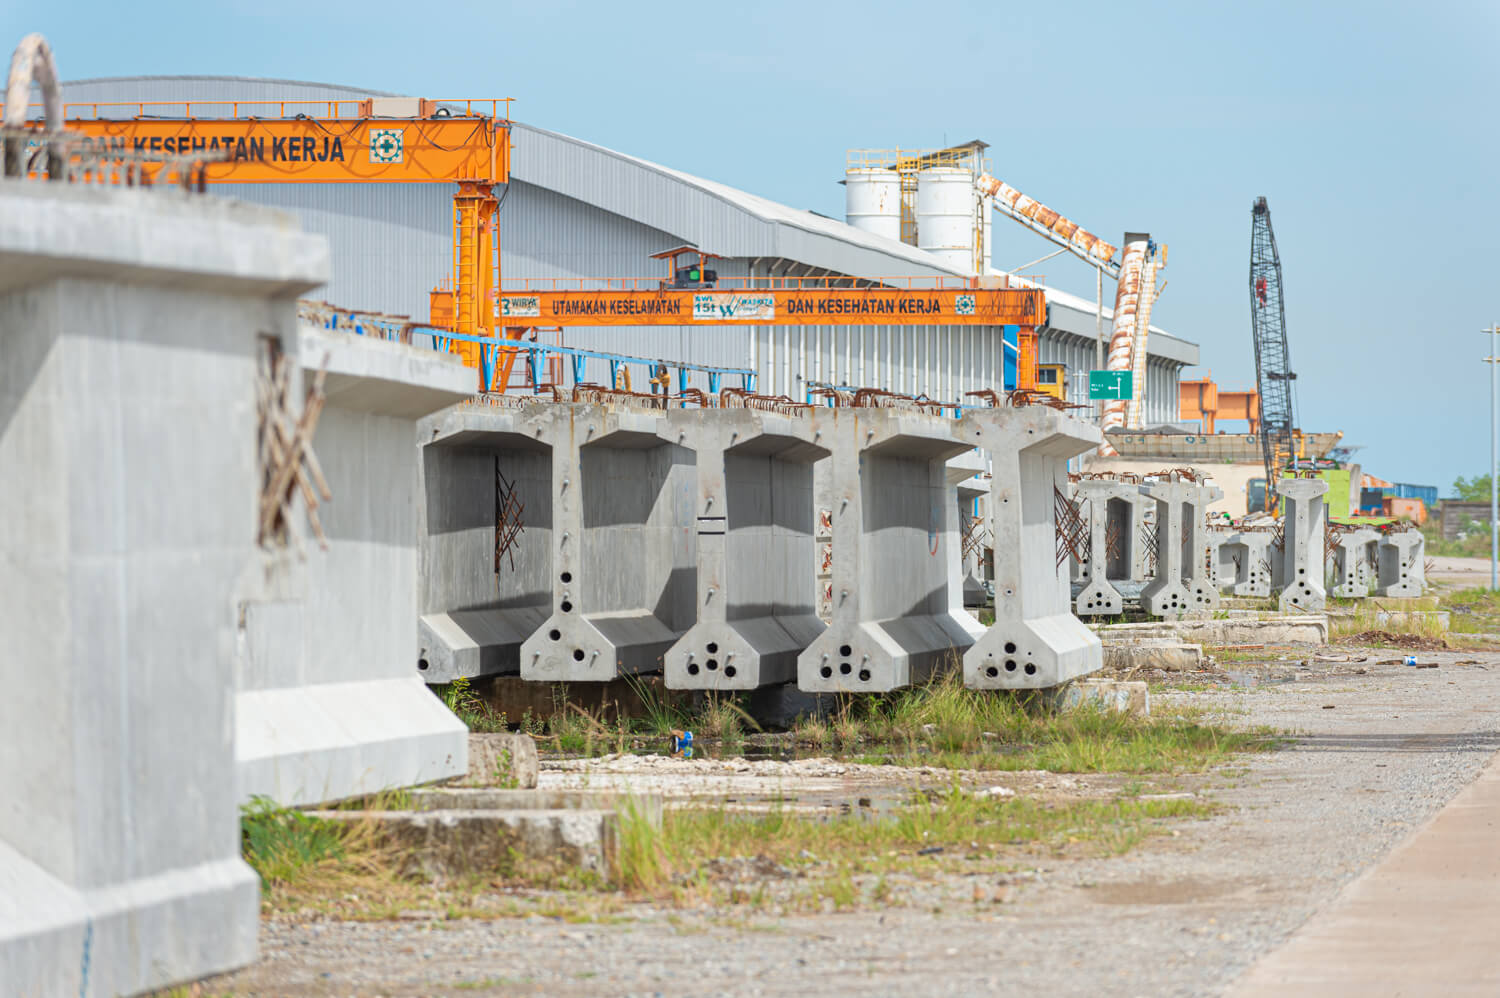
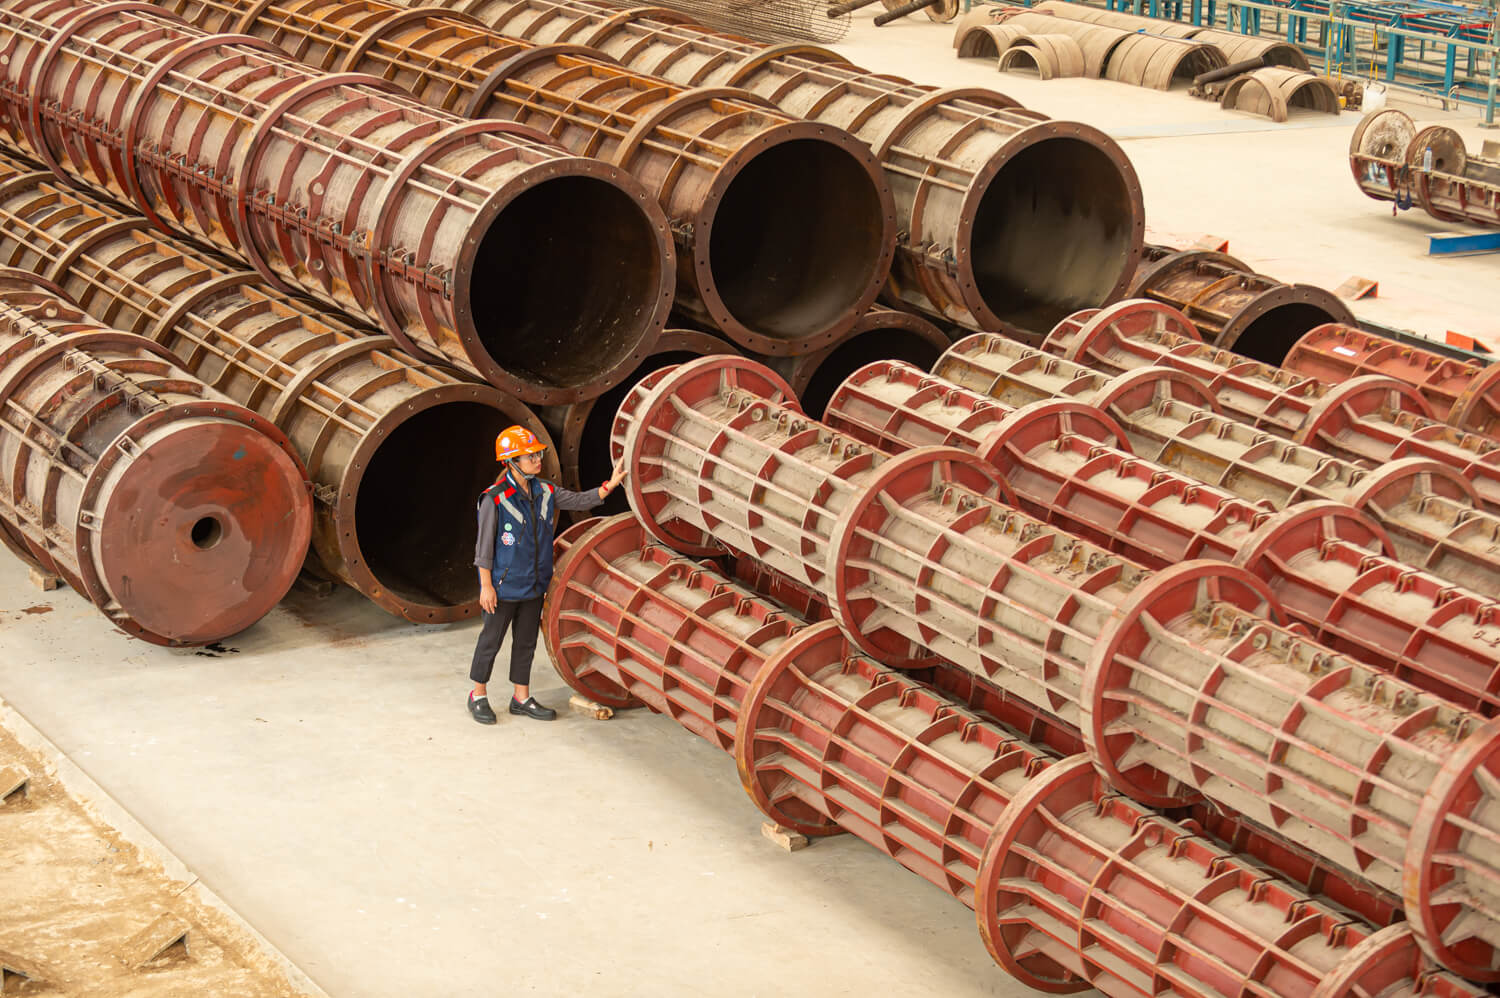
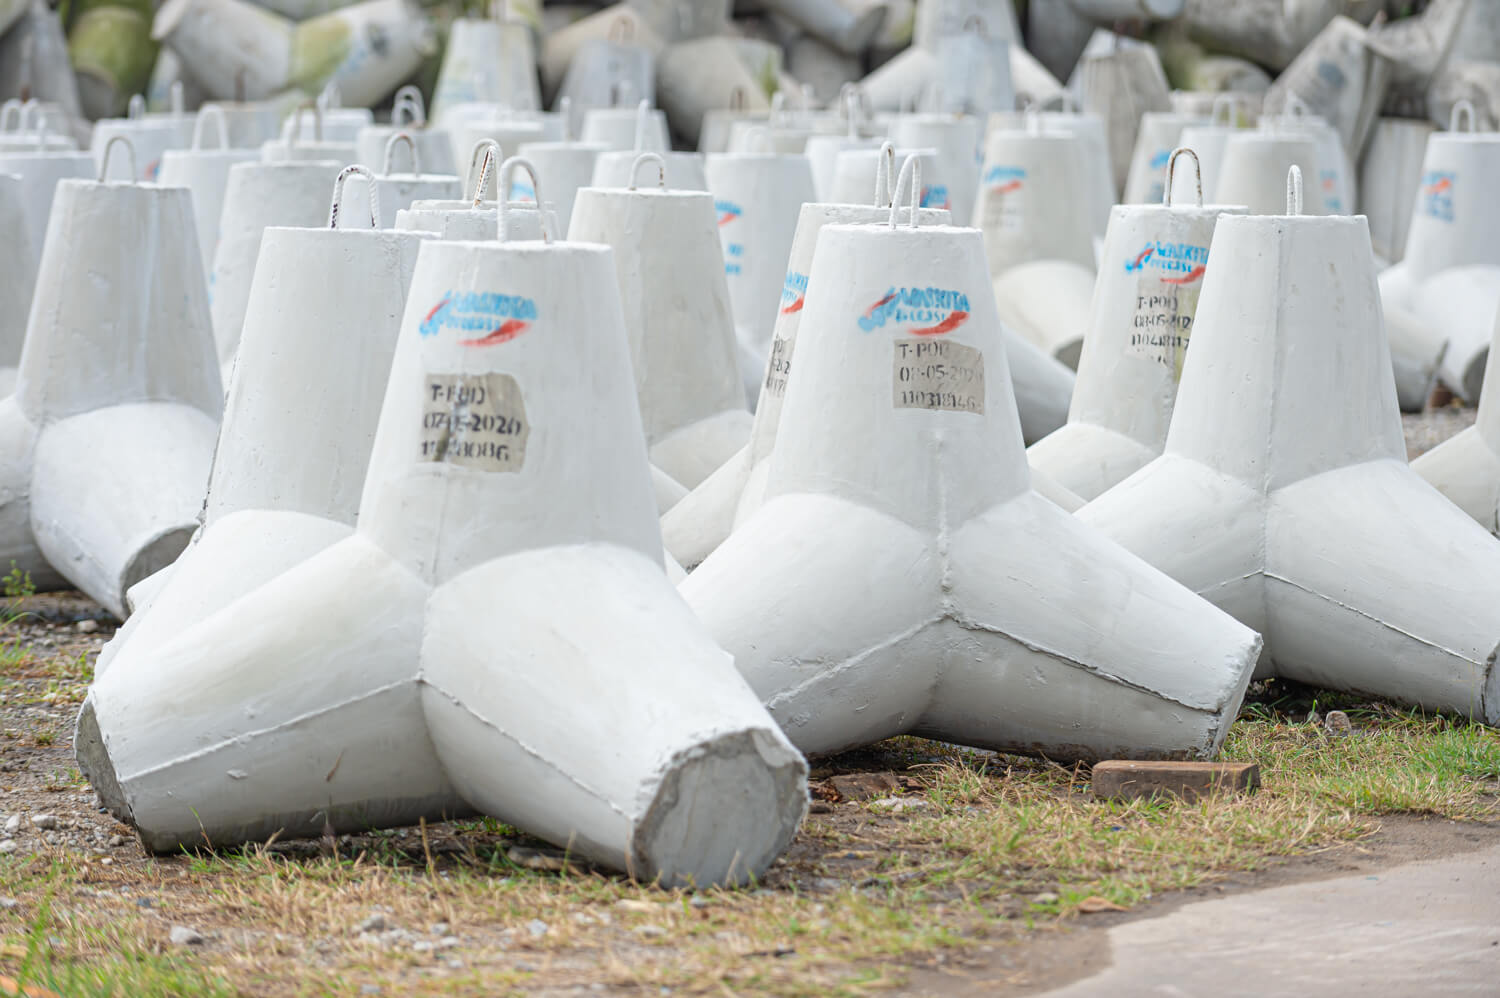
| Precast |
528.657 |
588.417 |
866,209 |
540,400 |
830,931 |
686,348* |
| Readymix and Quarry |
358.995 |
539.597 |
681,507 |
579,837 |
410,796 |
422,786* |
| Construction service |
280,513 |
206,385 |
424,181 |
367,351 |
820,444 |
270,937* |
| Cost of Revenues |
(966.674) |
(1.088.199) |
(1,602,222) |
(1,496,423) |
(1,757,946) |
(1,073,123) |
| Gross Profit (Loss) |
201,491 |
246,200 |
369,675 |
(8,835) |
304,225 |
306,949 |
| Sales Expenses |
(71.369) |
(99.167) |
(137,382) |
(93,827) |
(117,165) |
(154,906) |
| General and Administrative Expenses |
(273.467) |
(346.215) |
(473,731) |
(506,330) |
(543,518) |
(1,216,867) |
| Non-Contributing Plant Expenses |
(19.087) |
(64.917) |
(90,537) |
(114,993) |
(428,527) |
(361,571) |
| Final Income Tax Expenses |
(7.491) |
(1.835) |
(7,387) |
(1,275) |
(4,465) |
(8,654) |
| Gain (Loss) Foreign Exchange - Net |
- |
7 |
7 |
(64) |
294 |
516 |
| Interest Income |
1.948 |
2.164 |
2,629 |
2,131 |
1,848 |
1,166 |
| Net Other Income (Expenses) |
59,707 |
(163,990) |
(376,662) |
976,457 |
1,914,352 |
107,256 |
| Profit (Loss) Before Financial Cost and Tax |
(108.269) |
(427.753) |
(713,389) |
253,264 |
1,127,045 |
(1,326,112) |
| Financial Charges |
(215.950) |
(212.905) |
(283,913) |
(246,964) |
(451,275) |
(617,251) |
| Profit (Loss) Before Tax |
(324.219) |
(640.658) |
(997,302) |
6,300 |
675,770 |
(1,943,362) |
| Current Income Tax Expenses |
- |
- |
- |
- |
- |
- |
| Deferred Tax Expenses |
- |
- |
- |
- |
- |
- |
| Net Profit (Loss) for the Year |
(324.219) |
(640.658) |
(997,302) |
6,300 |
675,770 |
(1,943,362) |
| Other Comprehensive Income (Loss) |
| Remeasurement of Defined Benefit Obligations - Net |
- |
- |
632 |
(152) |
(449) |
(4,478) |
| Fixed Assets Revaluation Surplus (Deficit) |
- |
- |
- |
- |
- |
43,414 |
| Other Comprehensive Income |
- |
- |
77,088 |
(152) |
(449) |
38,937 |
| Total Comprehensive Profit (Loss) for the Year |
(324.219) |
(640.658) |
(920,214) |
6,149 |
675,321 |
(1,904,426) |
| Basic Earnings (Loss) per Share (in full Rupiah) |
(3,71) |
(11,11) |
(20.62) |
0.16 |
27.56 |
(79.27) |
*Restated due to reclassification of certain accounts